AI Automation — How a Simple Website Uptime Checker Became a Trustworthy Monitoring System
Role: AI Automation Builder, n8n Workflow Architect & Website Operations Engineer
Core Stack: n8n, Native HTTP Requests, State Tracking, Discord/Telegram Alerts, Conditional Logic, Multi-Site Monitoring
It Started With a Very Simple Problem
I manage multiple websites, client sites, business sites and web systems.
The problem with uptime is simple:
If a website goes down while nobody is checking it, the business may discover the problem from a customer instead of from its own systems.
I wanted a small n8n automation that could periodically check my websites and alert me when something stopped working.
The first idea was straightforward:
Every few minutes → request each website → if it fails, alert me.
I expected this to be one of the easiest automations I had built.
It was not.
V1 — The First Working Monitor
The first version used a Code node to perform HTTP requests and maintain website state.
It already included more than a simple ping.
The workflow could:
- Check several websites
- Treat HTTP 200–399 responses as healthy
- Optionally check for expected page text
- Retry failed requests
- Record response time
- Remember whether a site was previously UP or DOWN
- Send an initial DOWN alert
- Avoid repeating the same alert continuously
- Send periodic reminders when a site stayed down
- Send a separate RECOVERED notification
The alert itself was designed to be useful rather than simply saying “website down.”
It could include the affected site, URL, HTTP status, response time, number of attempts, error information and a troubleshooting checklist covering common areas such as hosting, DNS, SSL, WordPress and recent changes.
At this point I thought the important part of the project was already solved.
Then the monitor lied to me.
The Failure That Changed the Whole Project
During one test, the Code node returned an internal runtime error:
“fetch is not defined.”
The workflow interpreted that as:
“GFX Hawker is DOWN.”
But the website itself was not necessarily down.
The monitoring mechanism had failed.
That exposed a much more serious problem than I expected:
A monitoring system is useless if it cannot distinguish between “the website failed” and “the monitor failed.”
A false outage alert is not harmless.
If the system wakes me up, interrupts work or makes me start changing production infrastructure, I need to trust that the problem is real.
That became the real objective of the project.
Not:
“Can n8n ping my websites?”
But:
“Can I trust the alert enough to act on it?”
V2 — Move Configuration Out of the Monitoring Logic
The next problem was maintainability.
In V1, too much operational configuration lived inside code.
If I wanted to add a website, change a timeout, adjust retries or change reminder behavior, I should not have to edit monitoring logic.
So V2 separated configuration from execution.
The workflow gained structured settings for things such as:
- Website list
- Timeout
- Retry count
- Retry delay
- Repeat-alert interval
- Timezone
- User agent
- Discord alerts
- Telegram alerts
Websites became structured configuration instead of hardcoded monitoring instructions.
That meant I could expand coverage without rewriting the engine.
Credentials Became Their Own Responsibility
Another lesson was security.
Webhook tokens, bot credentials and other secrets should not be buried inside Code nodes.
Later versions moved alert integrations toward proper n8n Credentials and dedicated nodes.
This became part of a wider rule I now use across automation:
Configuration belongs in configuration. Secrets belong in credentials. Logic belongs in logic.
V3 — Stop Using Code as the HTTP Client
The `fetch is not defined` failure made one design flaw very clear:
The Code node was doing a job that n8n already had a native node for.
So in V3 I removed the network request from the Code node and introduced a native HTTP Request step.
Now the responsibilities were cleaner:
HTTP node: contact the website.
Logic/state layer: decide what the result means.
This immediately improved reliability because the HTTP request could use n8n’s own timeout, retry and error-handling behavior rather than depending on runtime-specific JavaScript features.
The HTTP checks also used no-cache behavior and a dedicated monitor user-agent so the requests behaved more like deliberate health checks.
Then the Website List Started Growing
Originally I was thinking mostly about homepages.
But a homepage being online does not mean the business is healthy.
What if:
- The shop is broken?
- A high-value service page is unreachable?
- The events section fails?
- The n8n instance itself stops responding?
- The portfolio page is down while the main domain still works?
So the monitoring configuration expanded from “check my domains” into “check my important production endpoints.”
The later system covered examples such as:
- GFX Hawker
- The n8n instance
- Media Print UAE homepage
- Media Print UAE events and service areas
- GFX Printer
- GFX Printer shop
- Dubai Sticker Printing
- Specific service landing pages
- Desired Momin
- Knowledge Hub
- Who Is Momin
- The Peak Society
- HamidNuh.com
- Portfolio and certification pages
This changed the operational question from:
“Is the domain alive?”
to:
“Are the pages and systems that actually matter still reachable?”
Then Another Problem Appeared — One Failed Check Does Not Mean the Website Is Down
Even with a good HTTP request, the internet is noisy.
A DNS lookup can fail once.
A server can respond slowly for a few seconds.
A network route can temporarily drop.
A single timeout should not automatically become a confirmed outage.
If the monitor alerts on every temporary hiccup, I will eventually stop trusting the alerts.
That led to V3.1 — Confirmed Alerts.
V3.1 — Require Consecutive Failures Before Declaring DOWN
The system gained a new rule:
One failed check is a warning signal. Multiple consecutive failed checks are evidence.
The saved V3.1 configuration requires two failed checks before a website becomes a confirmed DOWN state.
This gives transient failures a chance to disappear before the system interrupts me.
The request timeout was also increased in the later configuration, while retries remained part of the checking process.
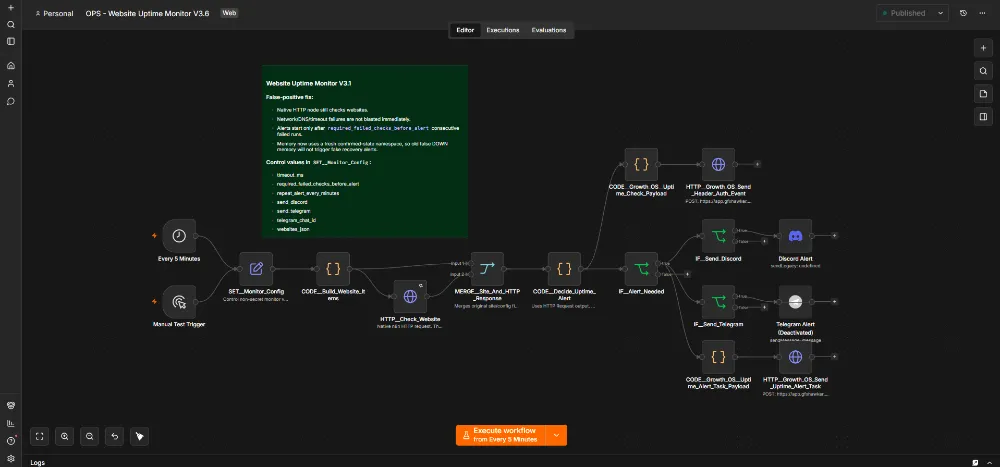
The architecture became:
Request fails → retry → next scheduled check also fails → only then declare a confirmed outage.
The Monitor Needed Memory — But Bad Memory Became Another Problem
State tracking is what allows the monitor to say:
“This site has just gone DOWN.”
instead of:
“This site is still down, here is the same message again every five minutes.”
But once the old monitor had incorrectly stored a site as DOWN, fixing the HTTP logic created a subtle new problem.
The corrected workflow could see a healthy website and announce:
“Website RECOVERED!”
even though the website may never have been down in the first place.
The old monitor had created bad state.
That taught me another systems lesson:
Fixing detection logic is not enough when historical state was created by broken detection logic.
The confirmed-state approach had to stop trusting old false-down memory blindly.
Alert Spam Became a State Problem, Not a Notification Problem
Another important design goal was avoiding alert fatigue.
If a site stays down for an hour, I do not need twelve identical DOWN messages.
The monitor therefore tracks state transitions.
The intended behavior became:
UP → DOWN: send the outage alert.
DOWN → still DOWN: stay quiet until the configured reminder interval.
DOWN → UP: send a recovery alert.
This made notification behavior depend on operational state instead of simply sending a message every time an HTTP request failed.
The Alerts Became Troubleshooting Tools
A useful uptime alert should reduce diagnosis time.
So instead of only saying:
“Media Print UAE is down.”
the message can include:
- Website name
- URL
- HTTP status
- Error information
- Response time
- Number of attempts
- Downtime start
- Troubleshooting guidance
The checklist can point me toward likely failure areas such as:
- Hosting/server
- DNS or Cloudflare
- SSL
- WordPress plugins/themes
- Recent deployments or changes
The monitor does not automatically diagnose every one of those systems.
The value is that the alert gives me a faster starting point.
Expected Content Added Another Layer Beyond HTTP Status
A website can return HTTP 200 and still be functionally wrong.
For important pages, the monitor can optionally expect particular content to be present.
This creates a simple but useful distinction:
“The server responded.”
versus:
“The expected page experience appears to be present.”
That is not full browser testing, but it is a stronger signal than HTTP status alone.
Then I Found the Architectural Limitation of Self-Hosted Monitoring
The monitor itself runs on infrastructure.
That creates an unavoidable question:
What happens if the machine running n8n goes down?
If the monitoring system and the thing it depends on fail together, the monitor may not be able to tell me that it is offline.
This taught me that an internal monitor is useful, but maximum reliability eventually requires an independent external layer watching the monitoring infrastructure itself.
I treat that as an architectural limitation rather than pretending one self-hosted workflow can observe every possible failure.
What the System Became
The final mental model became:
Schedule → Load Website Configuration → Native HTTP Check → Retry → Validate Status / Optional Expected Content → Compare With Confirmed State → Require Consecutive Failures → Decide Whether Alert Is Meaningful → Discord / Telegram Notification → Preserve State → Recovery Detection.
V1 → V3.1
V1:
Code-based HTTP requests, retries, state, DOWN/reminder/RECOVERED alerts.
V2:
Move website lists and operational settings out of code; improve credential handling and maintainability.
V3:
Replace fragile Code-node networking with native n8n HTTP Request nodes after the monitor itself generated a false outage.
V3.1:
Add confirmed-failure logic, cleaner state handling and stronger protection against false positives.
The Biggest Lesson
I started this project thinking uptime monitoring was about detecting failures quickly.
I ended up learning that a monitoring system has two equally important responsibilities:
Detect real failures.
and
Do not confidently report failures that are not real.
A monitor that misses every outage is useless.
But a monitor that constantly cries wolf is also useless because eventually the operator stops trusting it.
The real product is not the HTTP request.
The real product is trust in the alert.
What This Project Demonstrates
This project combines n8n automation, website operations, HTTP diagnostics, state management, alerting and failure-handling design.
But the most valuable part is the engineering progression.
I did not keep adding logic because more nodes looked impressive.
I added each layer when a real failure showed that the earlier version could produce a misleading operational decision.
That is how a simple uptime checker became a monitoring system I could actually trust.
Skills Demonstrated
n8n · Website Uptime Monitoring · HTTP Health Checks · Multi-Site Monitoring · State Management · Retry Logic · False-Positive Protection · Conditional Alerts · Discord Automation · Telegram Automation · Credential Management · Error Handling · Operational Monitoring · Website Troubleshooting · Production Automation · Systems Reliability